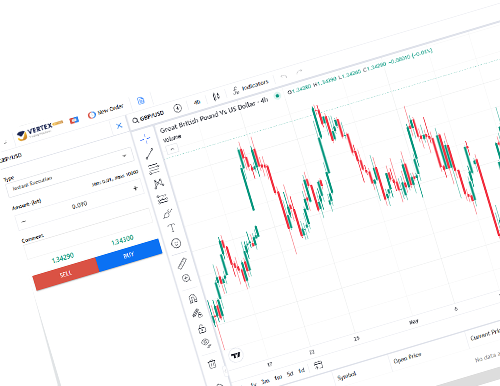
When you first open a forex trading chart, it might feel like stepping into a completely different universe. There are lines moving up and down, numbers constantly updating, and red and green shapes all over the place. These are called candlesticks and learning how to read them is important to understand what the market is trying to tell.
So, if you are just getting started and want to understand what those candlesticks mean and how they form patterns, this guide is for you.
What Are Candlesticks?
Candlesticks denote market price movement. They represent little summaries of what happened in the market over a specific period, either in one minute, one hour, one day, or one week.
You might have seen other types of charts before too, like line charts, bar charts, even Renko charts. But candlesticks are by far the most popular among forex traders because they pack a lot of useful information into a small space.
Each candlestick shows four things:
- Open (where the price started)
- Close (where the price ended)
- High (the highest point during that time)
- Low (the lowest point during that time)
And depending on whether the price went up or down during that period, the candle is colored green (for bullish) or red (for bearish). That is the basic idea.
Breaking Down a Candle – Bullish vs Bearish
Let’s simplify what a candle looks like.
- A bullish candle (usually green): The price started low and ended high. The open is at the bottom of the body, and the close is at the top.
- A bearish candle (usually red): The price started high and ended low. The open is at the top of the body, and the close is at the bottom.
The little lines sticking out from the top and bottom are called wicks (or shadows), and they show the highest and lowest points the price touched during that timeframe.
If your chart is set to 1 hour, then each candlestick shows what happened during that one hour.
What Is a Chart Pattern?
A candlestick by itself is helpful, but things get even more interesting when you start looking at patterns, i.e., groups of candlesticks that appear over and over again on charts.
Traders have observed that certain patterns tend to lead to certain price movements. So if you can spot those patterns, you can make more educated guesses about what might come next.
Now, keep this in mind: patterns do not guarantee anything. They just improve your odds.
There are three kinds of patterns you will usually hear about:
- Continuation patterns – Price is likely to keep going in the same direction.
- Reversal patterns – Price might be about to change direction.
- Bilateral patterns – Price could go either way (useful in volatile markets).
Let’s walk through the most common ones.
Top Chart Patterns
- Ascending and Descending Triangle
If the price keeps hitting the same resistance (horizontal line at the top), but the lows are getting higher. This forms a kind of triangle that is “pushing” upward.
This is the ascending triangle, and it usually signals a breakout to the upside once the resistance breaks.
You will often see this after an uptrend, so traders keep an eye on this to potentially enter long trades.
Now flip that triangle upside down.
A descending triangle forms when the price keeps bouncing off the same support level, but the highs are getting lower. Eventually, pressure builds up, and the price often breaks downward.
This is a bearish pattern and often appears after a downtrend.
- Symmetrical Triangle
This one is a little trickier. Both the highs and the lows are getting closer together. In this pattern, the market is coiling up for a big move but you do not know in which direction yet.
That is why the symmetrical triangle is considered a bilateral pattern. Traders usually wait for a breakout either up or down before making a move.
- Flag
When a strong price move is followed by a pause, where the price moves in a small downward (or upward) channel, that pause is the flag.
It is usually a breather before the market continues in the same direction.
So if the flag follows a bullish move, it is a bullish flag and might signal more upward movement.
4.Wedge
Wedges are like flags, but the lines converge rather than stay parallel.
A falling wedge often leads to an upward breakout.
A rising wedge often leads to a downward breakout.
Volume tends to shrink during a wedge, then pick up when the breakout happens.
- Double Top and Double Bottom
These two patterns look like the letter M (double top) and W (double bottom).
A double top means the price tried to go up twice and failed – this often signals a downtrend.
A double bottom means the price tried to go down twice and failed – this often signals an uptrend.
Traders look for confirmation before acting.
- Head and Shoulders
This one is easy to spot. It includes 3 peaks: the middle one is the highest (the “head”), and the two on the sides are the “shoulders.”
This head and shoulders pattern usually signals a reversal from bullish to bearish.
There is also an inverse head and shoulders pattern, which is the opposite as it suggests a reversal from bearish to bullish.
- Rounded Top and Rounded Bottom
These are slow-forming patterns that show a gradual change in market sentiment.
A rounded top signals a slow reversal from bullish to bearish.
A rounded bottom signals a slow reversal from bearish to bullish.
They often take longer to form but are more stable once they do.
- Cup and Handle
This one really does look like a coffee cup. There is a rounded bottom (the cup), followed by a small dip (the handle), then a breakout.
This cup and handle is considered a bullish pattern and usually signals a continuation of an uptrend.
How Do You Actually Trade These?
Let’s break it down:
- First you need to spot the pattern. Do not jump in too quickly and let it form completely.
- Confirm it. Look at volume, past price levels, and wait for a breakout to happen.
- Use a stop loss. Always have a point where you cut your losses.
- Set a profit target and know when to exit.
For example, in a bullish flag pattern, once price breaks resistance, traders can wait for a couple of green candles before entering.
Risk Management is Key
Even the most reliable pattern can fail. That is just the nature of trading. Use these basic rules to manage risk:
- Do not go all-in on one trade.
- Always use stop-loss orders.
- Have a plan before you enter a trade.
- Do not chase trades and wait for confirmation.
Final Thoughts
Candlestick patterns are not magic but they are powerful tools, especially when combined with good risk management and a bit of patience. For beginner traders, understanding these shapes and formations is like learning the market’s language. And once you understand it, you will start to understand its rhythm, its moods, and its possibilities.
Take it one chart at a time. Start by just watching. Then, slowly practice spotting patterns. Before long, you won’t just be reacting to the market but reading it like a book.


